how to read a candlestick chart
Hey teenagetraders! Want to up your investing game? Learning to read a candlestick stock graph is a great place to start. These charts can look a bit confusing at first, but once you get the hang of them, they’re super helpful for understanding stock price movements. Let’s break it down!
1. The Basics of Candlestick Charts
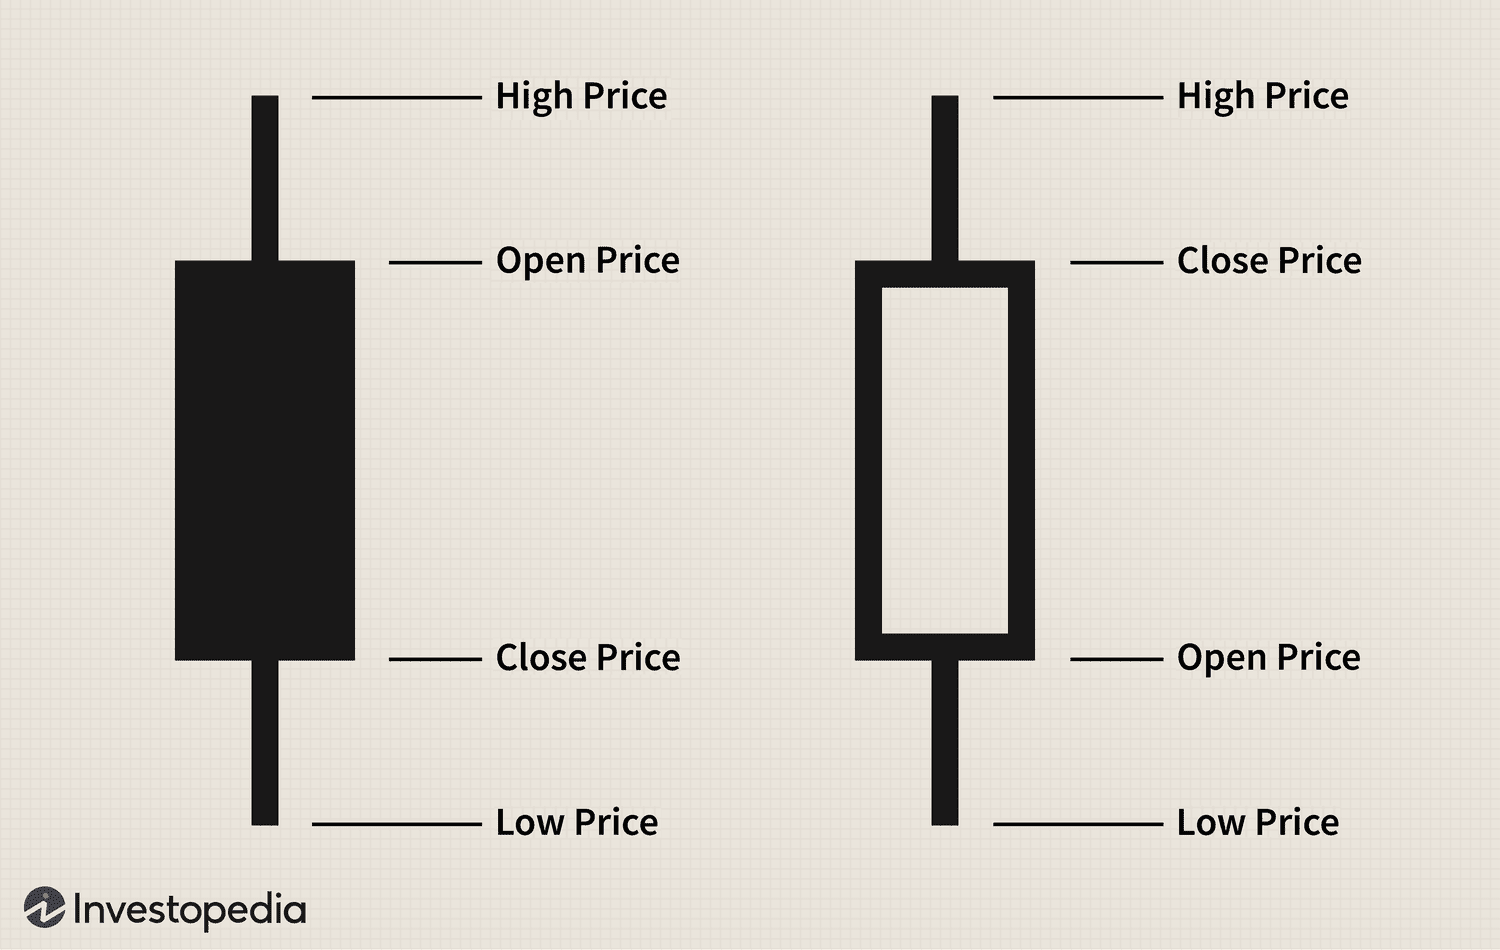
A candlestick chart is a type of financial chart used to describe price movements of a security, derivative, or currency. Each "candlestick" typically represents one day and shows four key pieces of information: the opening price, closing price, high price, and low price.
Key Components:
Body: The rectangular part of the candlestick. It shows the opening and closing prices.
Wicks (or Shadows): The lines above and below the body. They show the highest and lowest prices during the time period.
Color: The color of the candlestick body indicates whether the price increased or decreased. Typically, green or white means the price went up (bullish), and red or black means the price went down (bearish).
source: investopedia
2. Understanding the Candlestick Anatomy
Let's look at a single candlestick and what it tells us:
Bullish Candlestick:
Open: The bottom of the body.
Close: The top of the body.
High: The top of the upper wick.
Low: The bottom of the lower wick.
Color: Usually green or white, indicating the price closed higher than it opened.
Bearish Candlestick:
Open: The top of the body.
Close: The bottom of the body.
High: The top of the upper wick.
Low: The bottom of the lower wick.
Color: Usually red or black, indicating the price closed lower than it opened.
3. Recognizing Common Candlestick Patterns
Candlestick patterns can provide insights into future price movements. Here are some common ones to look for:
Single Candlestick Patterns:
Doji: The open and close prices are very close, forming a small body. It suggests market indecision.
Hammer: A small body at the top with a long lower wick. It indicates a potential reversal from a downtrend to an uptrend.
Multiple Candlestick Patterns:
Engulfing Pattern: A small candlestick followed by a larger one that "engulfs" it. A bullish engulfing pattern suggests a potential uptrend, while a bearish engulfing pattern suggests a potential downtrend.
Morning Star: A three-candlestick pattern with a short body between a long bearish candlestick and a long bullish candlestick. It signals a potential reversal from a downtrend to an uptrend.
4. Using Candlestick Charts for Analysis
Candlestick charts can be used in various ways to analyze and predict price movements.
Steps for Analysis:
Identify the Trend: Look at the overall direction of the candlesticks. Are they mostly moving up, down, or sideways?
Spot Patterns: Look for candlestick patterns that indicate potential reversals or continuations of the trend.
Confirm with Volume: Higher trading volume can confirm the strength of a candlestick pattern.
5. Practical Example
Imagine you’re looking at a candlestick chart for a stock you’re interested in. You notice a bullish engulfing pattern after a period of declining prices. This pattern suggests that the downtrend might be reversing, and it could be a good time to buy.
6. Tips for Reading Candlestick Charts
To get the most out of candlestick charts, keep these tips in mind:
Practice Regularly: The more you look at candlestick charts, the more familiar you’ll become with patterns and trends.
Use with Other Tools: Combine candlestick analysis with other technical indicators like moving averages and RSI for better accuracy.
Stay Updated: Follow market news and trends to understand the context behind the price movements.
Final Thoughts
Reading candlestick stock graphs can seem daunting at first, but with practice, you'll get the hang of it. They offer a visual and detailed way to track stock price movements and make more informed investment decisions. Keep practicing, stay curious, and soon you'll be reading candlestick charts like a pro.
Stay savvy and keep trading, Your teenagetraders Team 📈🌟
